| Introduction | Milano Data Analysis | Trento Data Analysis | Weather Correlation |
As per the already defined queries, the telecommunication data was merged before applying the analysis techniques. Data was given with an interval of 10 minutes for sms in and out, calls in and out, and internet activity.
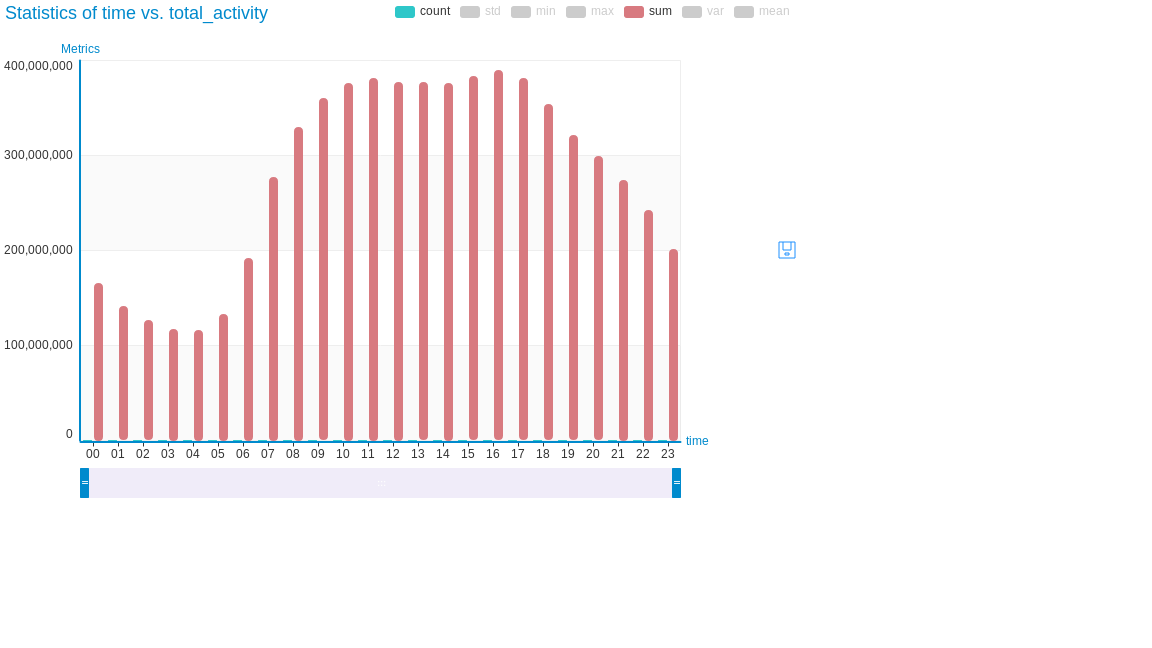
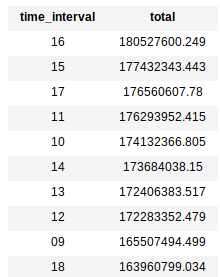
Milano Congested Hours
I merged all this data on the basis of timestamp. Then the data was grouped together for the same hours. The same approach has been applied for the data of each day for November and December. In the end, the hours with maximum telecommunication congestion were filtered out.
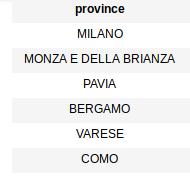
Most Called Province From Milano
I read all the csv files from the directory through GraphLab as one single frame. The GraphLab makes it easy to read hundreds and thousands of files in parallel and returns them as a single frame. The returned frame was then processed to find out the provinces where people of Milan called the most.
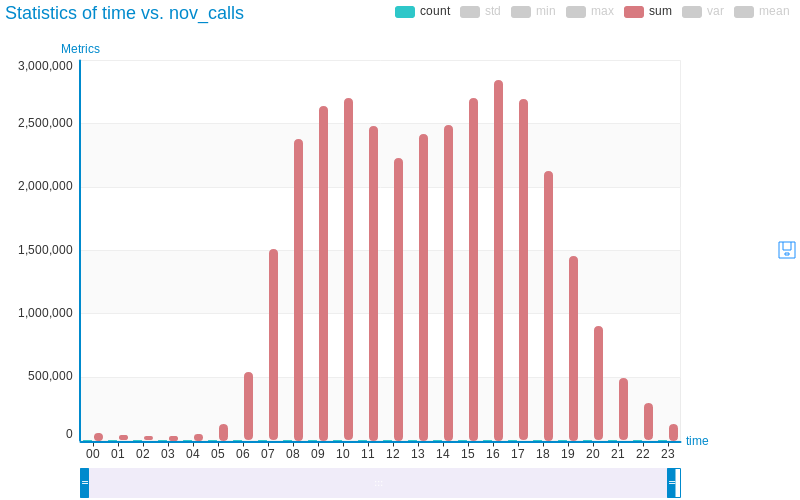
Telecommunication activities in November and December 2013
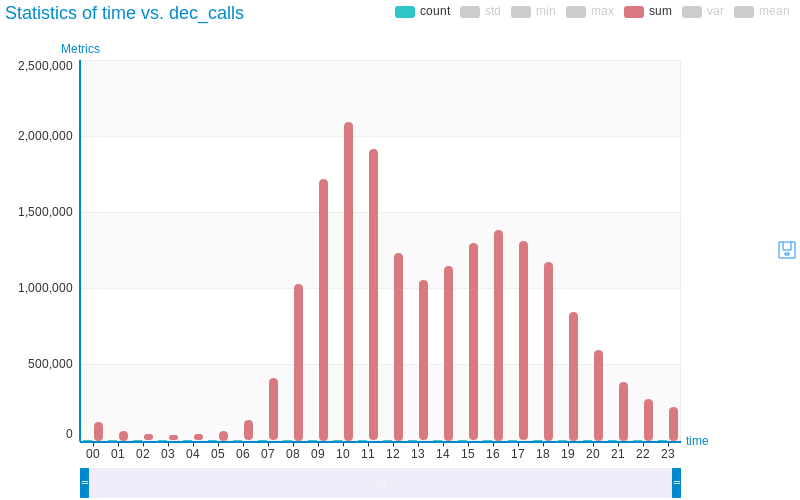
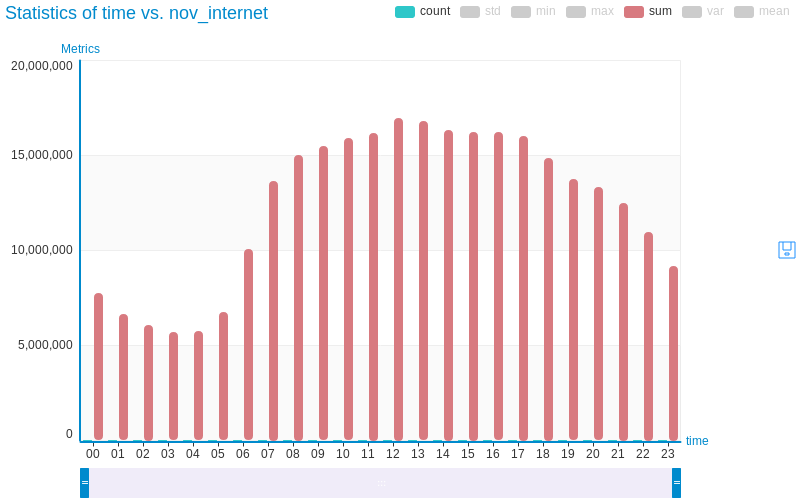
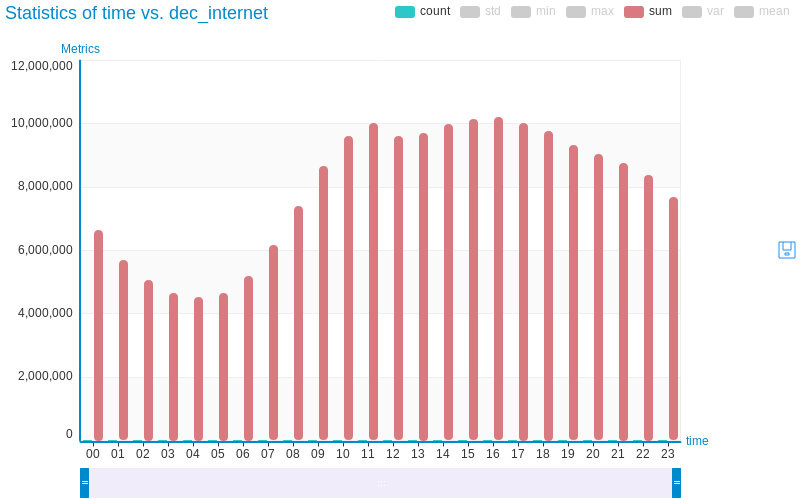
The data was given in two parts Nov and Dec. The purpose of this study was to analyse and compare the telecommunication activities of users for two different months. Following are the graphs of 4 columns Nov calls, Dec calls, Nov internet, and Dec internet. The results clearly show that the calls made in November are higher than December. In November, the most busy time periods were from 9 to 10 and then from 15 to 17. If we look at the results of December we can see that the most calls made were between 9 and 11. At 10, it was the most busy hour but in total the calls made in December were a lot lower in numbers than November.
Similarly, the internet usage as per the results, was higher in November than December. The results are drawn for 24 hours and it recorded high usage of internet from 10 to 17 in November. If we compare the results of November with December, the high use was recorded at 11 and then from 14 to 17 in December.
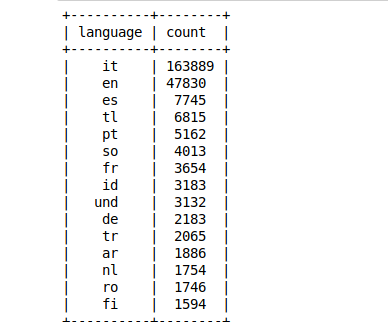
Most Tweeted Languages
This dataset contains data derived from an analysis of geolocalized tweets originated from Milan during the months of November and December.
Each row corresponds to a tweet. For privacy issues the user id has been obfuscated and the text has been replaced with a list of entites extracted by the Entity Extraction API tool. Entities are provided as links to DBpedia. If we look at the results, they indicate that Italian was the most tweeted language, whereas English being the second and Spanish the third famous.
Telecommunication activities comparison of day and night usage
To answer the question about communication pattern of users during day and night, the following bar chart gives a clear sight. It shows a continuous increase in usage from 8AM. There is a significant difference in usage during the day time and night time. From 8AM, the user’s activity in increasing but after 8PM its very low until 3AM. At 3 and 4 Am it is at its lowest.