| Introduction | Milano Data Analysis | Trento Data Analysis | Weather Correlation |
At the beginning of 2014, Telecom Italia launched the first edition of the Big Data Challenge, a contest designed to stimulate the creation and development of innovative technological ideas in the Big Data field. For the analysis purpose, I used the data of two provinces Milano and Trento to analyse telecommunication activities, usage pattern, usage during the day and night. For the very provinces, i analysed the weather data and tried to find out the correlation between different weather conditions (clear, rainy, snow) and communication pattern. Since, the volume of data was huge, so a good way to apply the analysis methods was to use GraphLab as the purpose of this study was to learn parallel computation with big data.
Data Description
In this study i used three general kinds of datasets - Milano Dataset, Trento Dataset and Weather Dataset. Weather data tells us the precipitation of every hours. Originally the data recorded was for every 10 minutes interval for all the given datasets. The Milano and Trento datasets include SMS in and out, calls in and out, and internet activity for the month of November and December 2013.The data was recorded with a 10 minute intervals for all the given features. The volume of this dataset was huge, approximately 46 gigabytes.
Analysis Tasks:
The focus of this study was first wrangling the data and then finding out answers of the following queries:
- Find out the most called province by the people of Milano and Trento.
- Find out the congested communication hours in Milano and Trento.
- Find out the most tweeted languages in Milano for the given dates.
- Compare telecommunication usage of November and December 2013.
- Analyse and find out the pattern of telecommunication activities during the day time and night.
- Analyse the data and find out correlation between telecommunication activities for different weather conditions (Clear, Rain, Snow).
Provinces Data for Milano & Trento
This dataset provides information regarding the level of interaction between the Province of Trento and the Italian provinces. The level of interaction between an area A of the Province of Trento and a province B is given as a pair of decimal numbers. The first number is proportional to the number of calls issued from the area B to the province A, the second one is proportional to the number of calls from the province A to the area B.
Spatial Aggregation: the Trentino GRID squares and the Italian provinces. Temporal aggregation: the values are aggregated in timeslots of ten minutes. The data had following features. Square id: the id of the square of the Trentino GRID; TYPE: numeric Province: the name of the Italian province; TYPE: string Time Interval: the beginning of the time interval expressed as the number of millisecond elapsed from the Unix Epoch on January 1st, 1970 at UTC. The end of the time interval can be obtained by adding 600000 milliseconds (10 minutes) to this value. TYPE: numeric Square to Province Interaction: a value representing the interaction between the Square id and the Province. This value is proportional to the number of calls exchanged between callers located in the Square id and receivers located in the Province. TYPE: numeric Province to Square Interaction: a value representing the interaction between the Square id and the Province. This value is proportional to the number of calls exchanged between callers located into the Province and receivers located into the Square id. TYPE: numeric
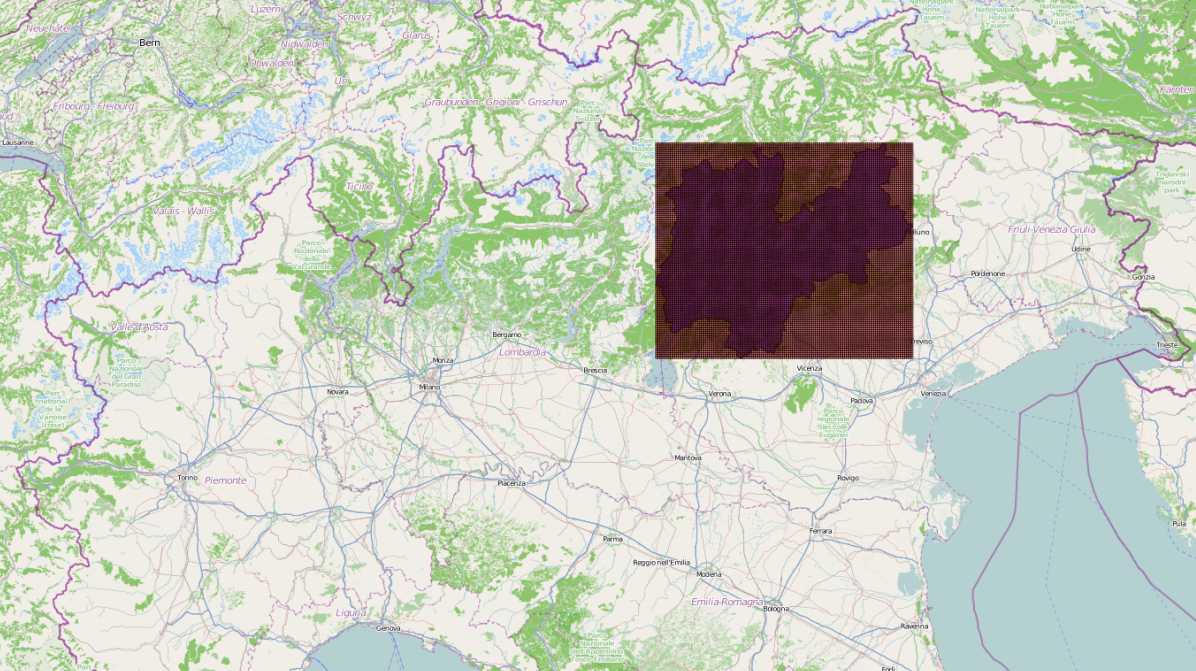
The grid consists of a cell id and the cell geometry, which is expressed as geoJSON. The portion of territory covered by the grid is shown in the following picture where the grid (red-gray) is overlaid to the northern part of Italy. The Trentino province is highlighted in violet.
Telecommunication Data
The dataset is the result of a computation over the Call Detail Records (CDRs) generated by the Telecom Italia cellular network over the Province of Milano & Trento. CDRs log the user activity for billing purposes and network management. There are many types of CDRs, for the generation of this dataset we considered those related to the following activities:
Received SMS: a CDR is generated each time a user receives an SMS Sent SMS: a CDR is generated each time a user sends an SMS Incoming Calls: a CDR is generated each time a user receives a call Outgoing Calls: CDR is generated each time a user issues a call Internet: a CDR is generate each time a user starts an internet connection a user ends an internet connection during the same connection one of the following limits is reached: 15 minutes from the last generated CDR 5 MB from the last generated CDR By aggregating the aforementioned records it was created this dataset that provides SMSs, calls and Internet traffic activity. It measures the level of interaction of the users with the mobile phone network; for example the higher is the number of SMS sent by the users, the higher is the activity of the sent SMS. Measurements of call and SMS activity have the same scale (therefore are comparable); those referring to Internet traffic do not.
Weather Data
This dataset contains measurements about temperature, precipitation and wind speed/direction taken in 36 Weather Stations. The collection of precipitation data is not continuous due to technical issues (e.g. snow over the sensor radar). This set provides information on whether data has been collected or not for a specific time interval. Spatial Aggregation: each record refers to the whole Trento province; higher spatial granularity is not required given that the availability of the data is not location specific. Either they are available for the whole territory or they are completely missing. Temporal Aggregation: 10 minutes
Social Pulse
This dataset contains data derived from an analysis of geolocalized tweets originated from the Province of Trento and Milano, during the months of November and December 2013. Each row corresponds to a tweet. For privacy issues the user id has been obfuscated and the text has been replaced with a list of entites extracted by the Entity Extraction tool. Entities are provided as links to DBpedia. The geo-location of the tweets is approximated, with a maximum error of 600 meters.